
myanywAiR NEXT PLUS
Extended Graphs and Logs
View detailed weekly and monthly operating history
With myanywAiR NEXT PLUS, you can view weekly and monthly graphs to better understand air conditioner activity, performed actions, automation triggers and historical operating data.
Available graph views
| Weekly | Monthly |
|---|---|
Review recent activity and short-term operating trends. 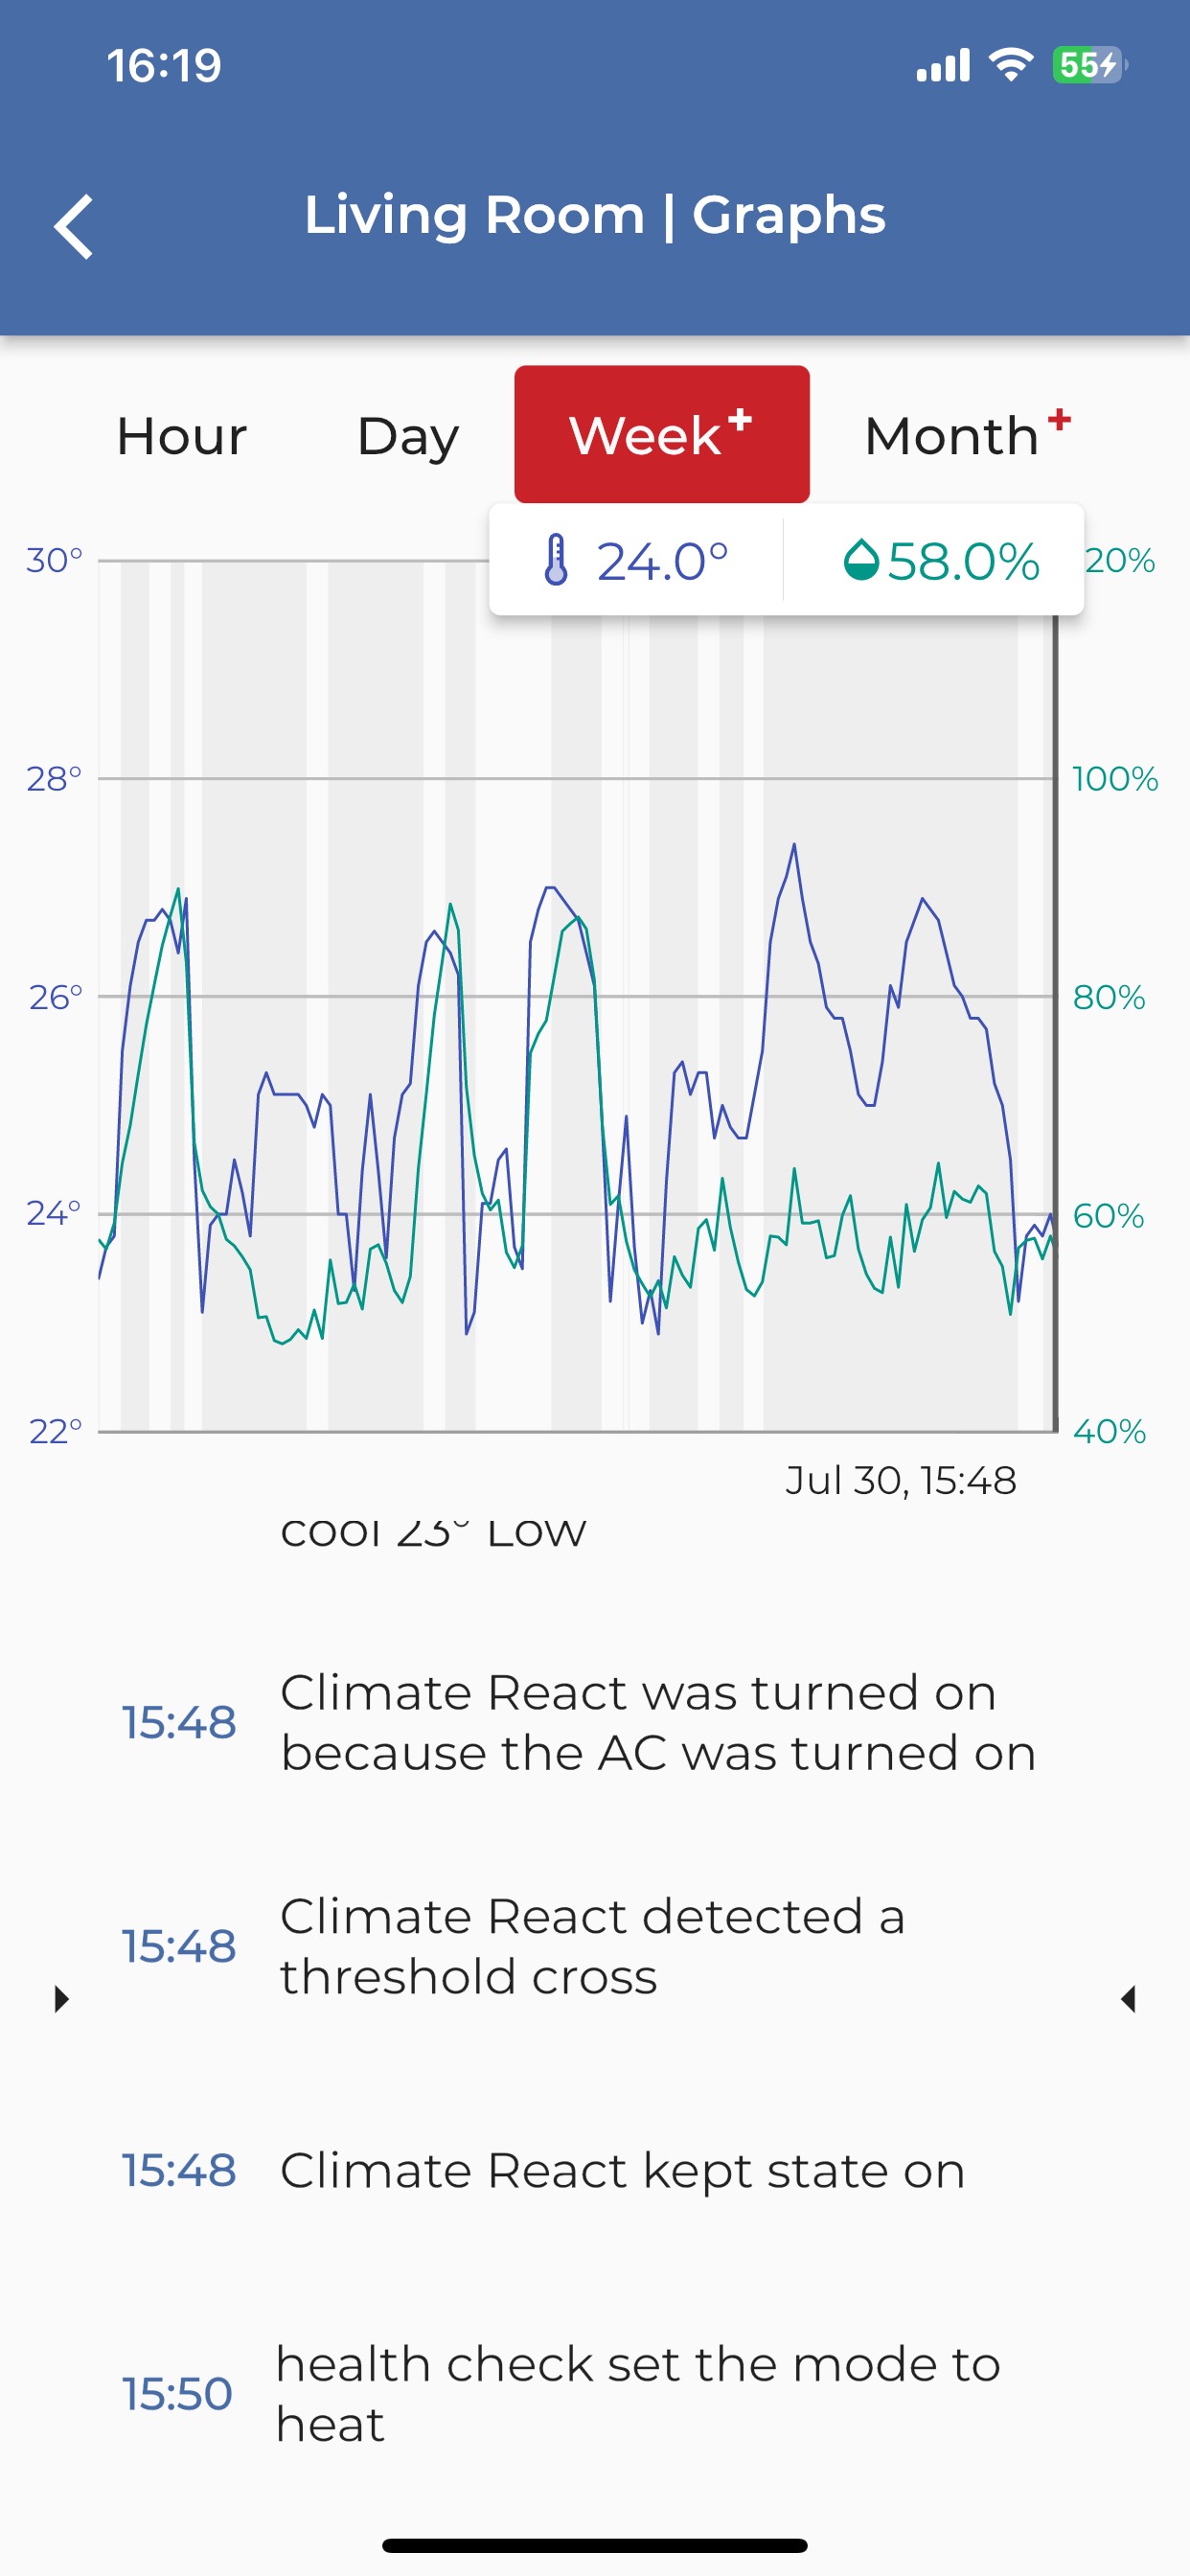 | Review longer-term patterns and historical performance. 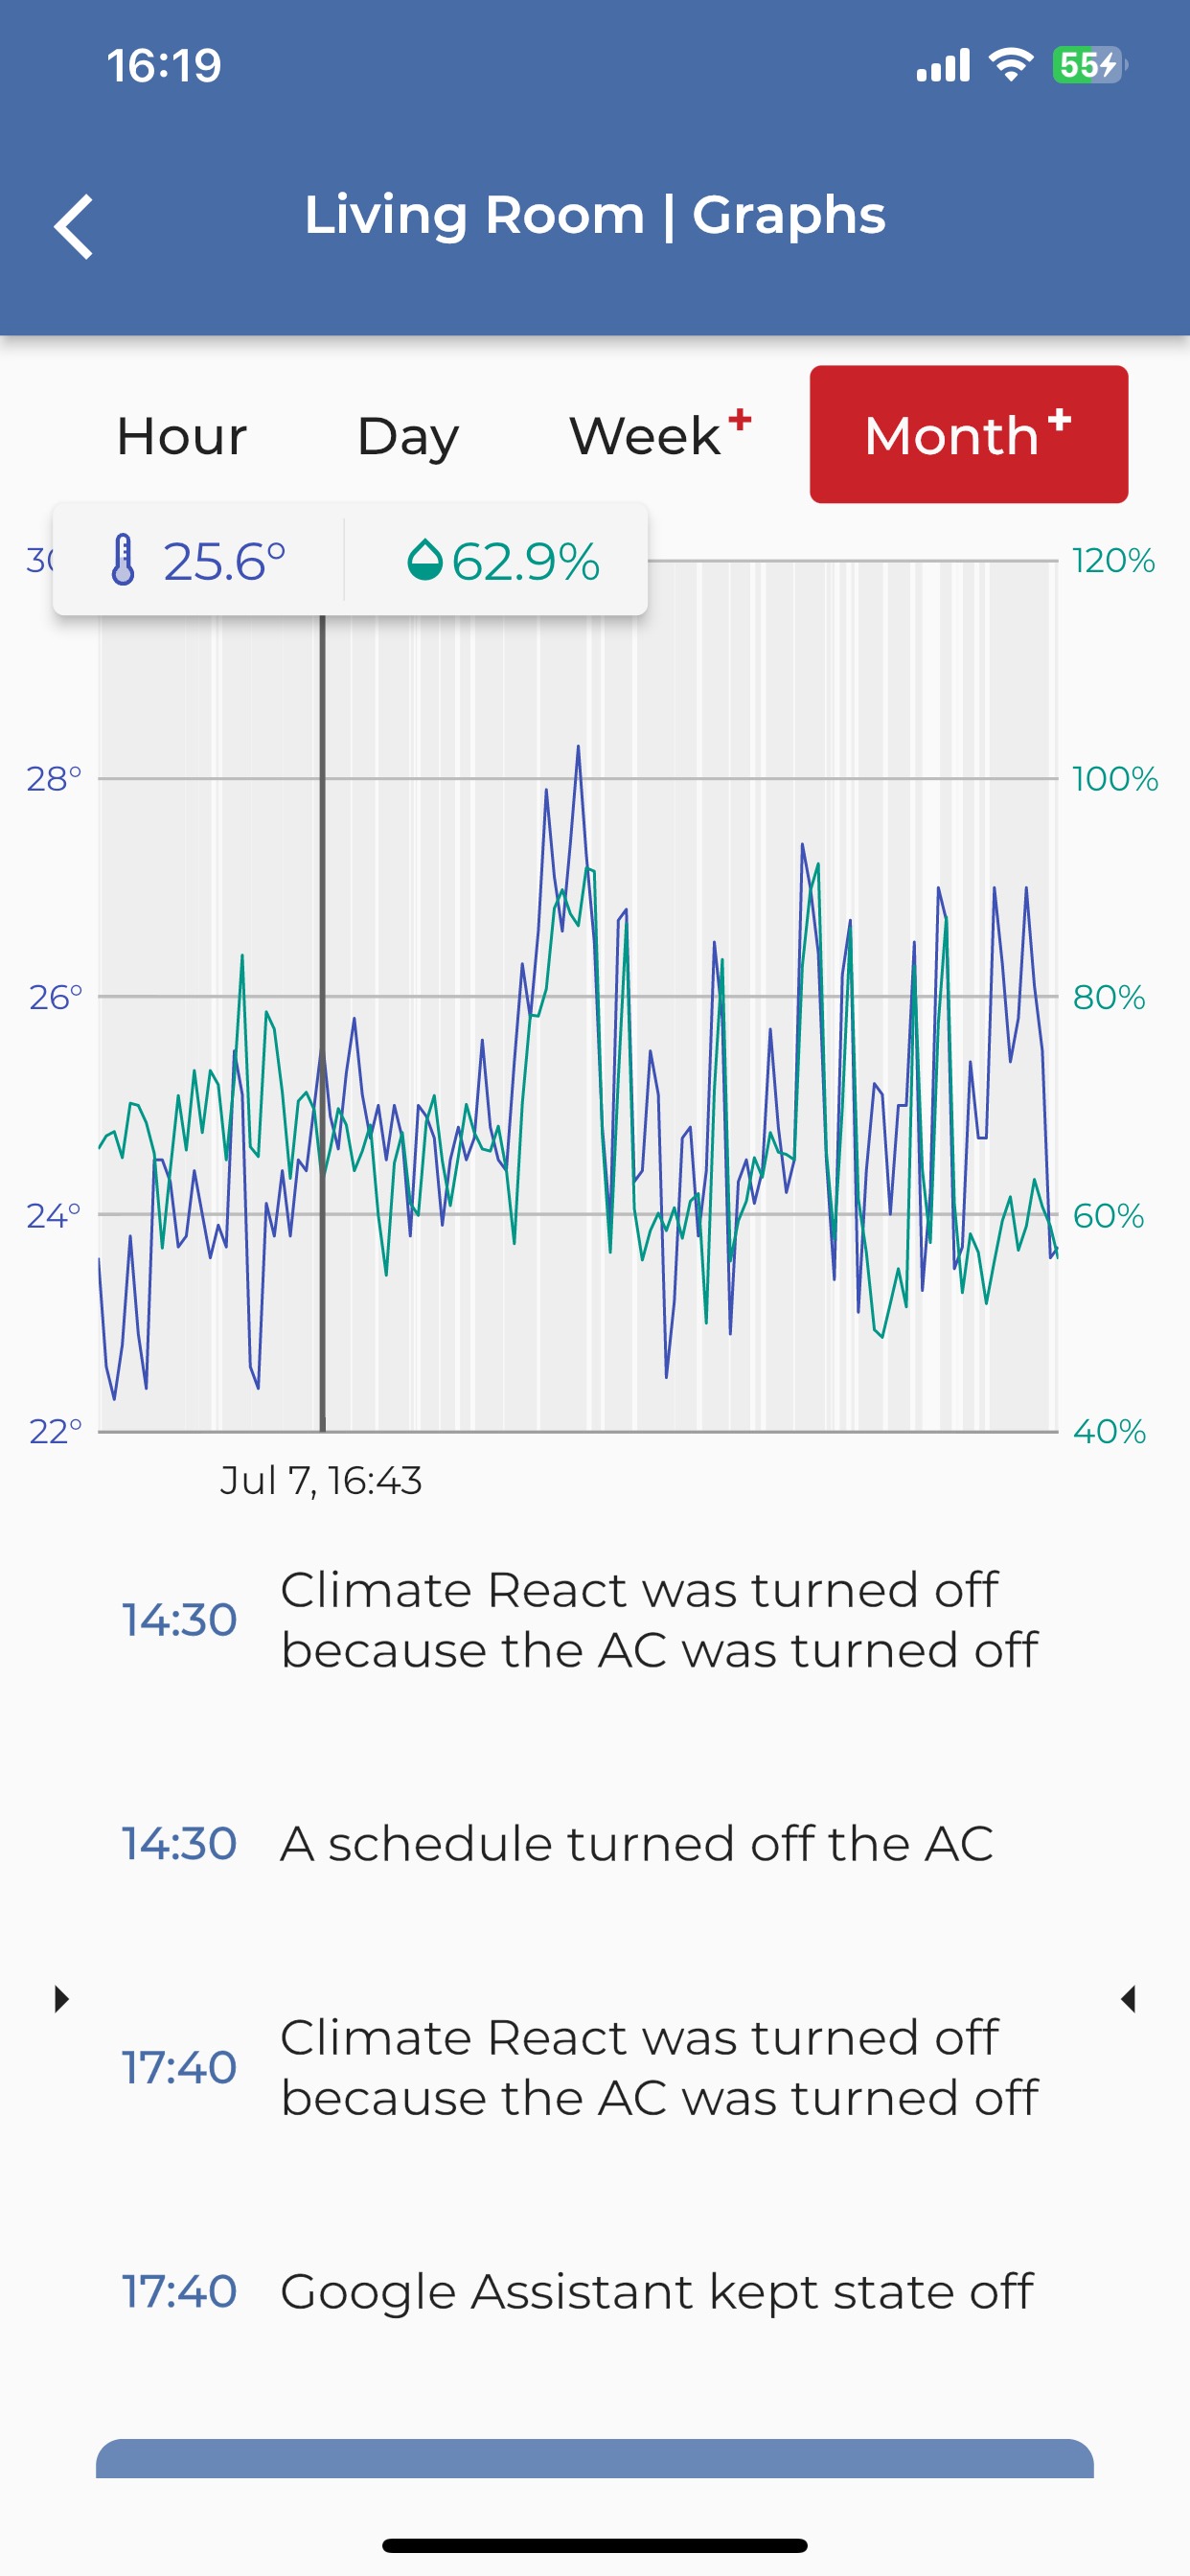 |
What the graphs can help you understand: performed actions, automation triggers and historical operating data over weekly or monthly periods.