
General Assist How-To Guide
How to View Graphs & Logs with myanywAiR NEXT
Review room conditions, air-quality data and the device event history
The Graphs & Logs feature provides a visual history of available room-condition data and a time-stamped record of actions or changes made to the device.
Availability: The information shown depends on the myanywAiR NEXT hardware, connected sensors, app version and active subscription features. Some graphs or longer viewing periods may not be available on every installation.
Open Graphs & Logs
| 1 | Open the myanywAiR NEXT app and select the device or room you wish to review. |
| 2 | Swipe up from the bottom of the device screen to open the feature drawer.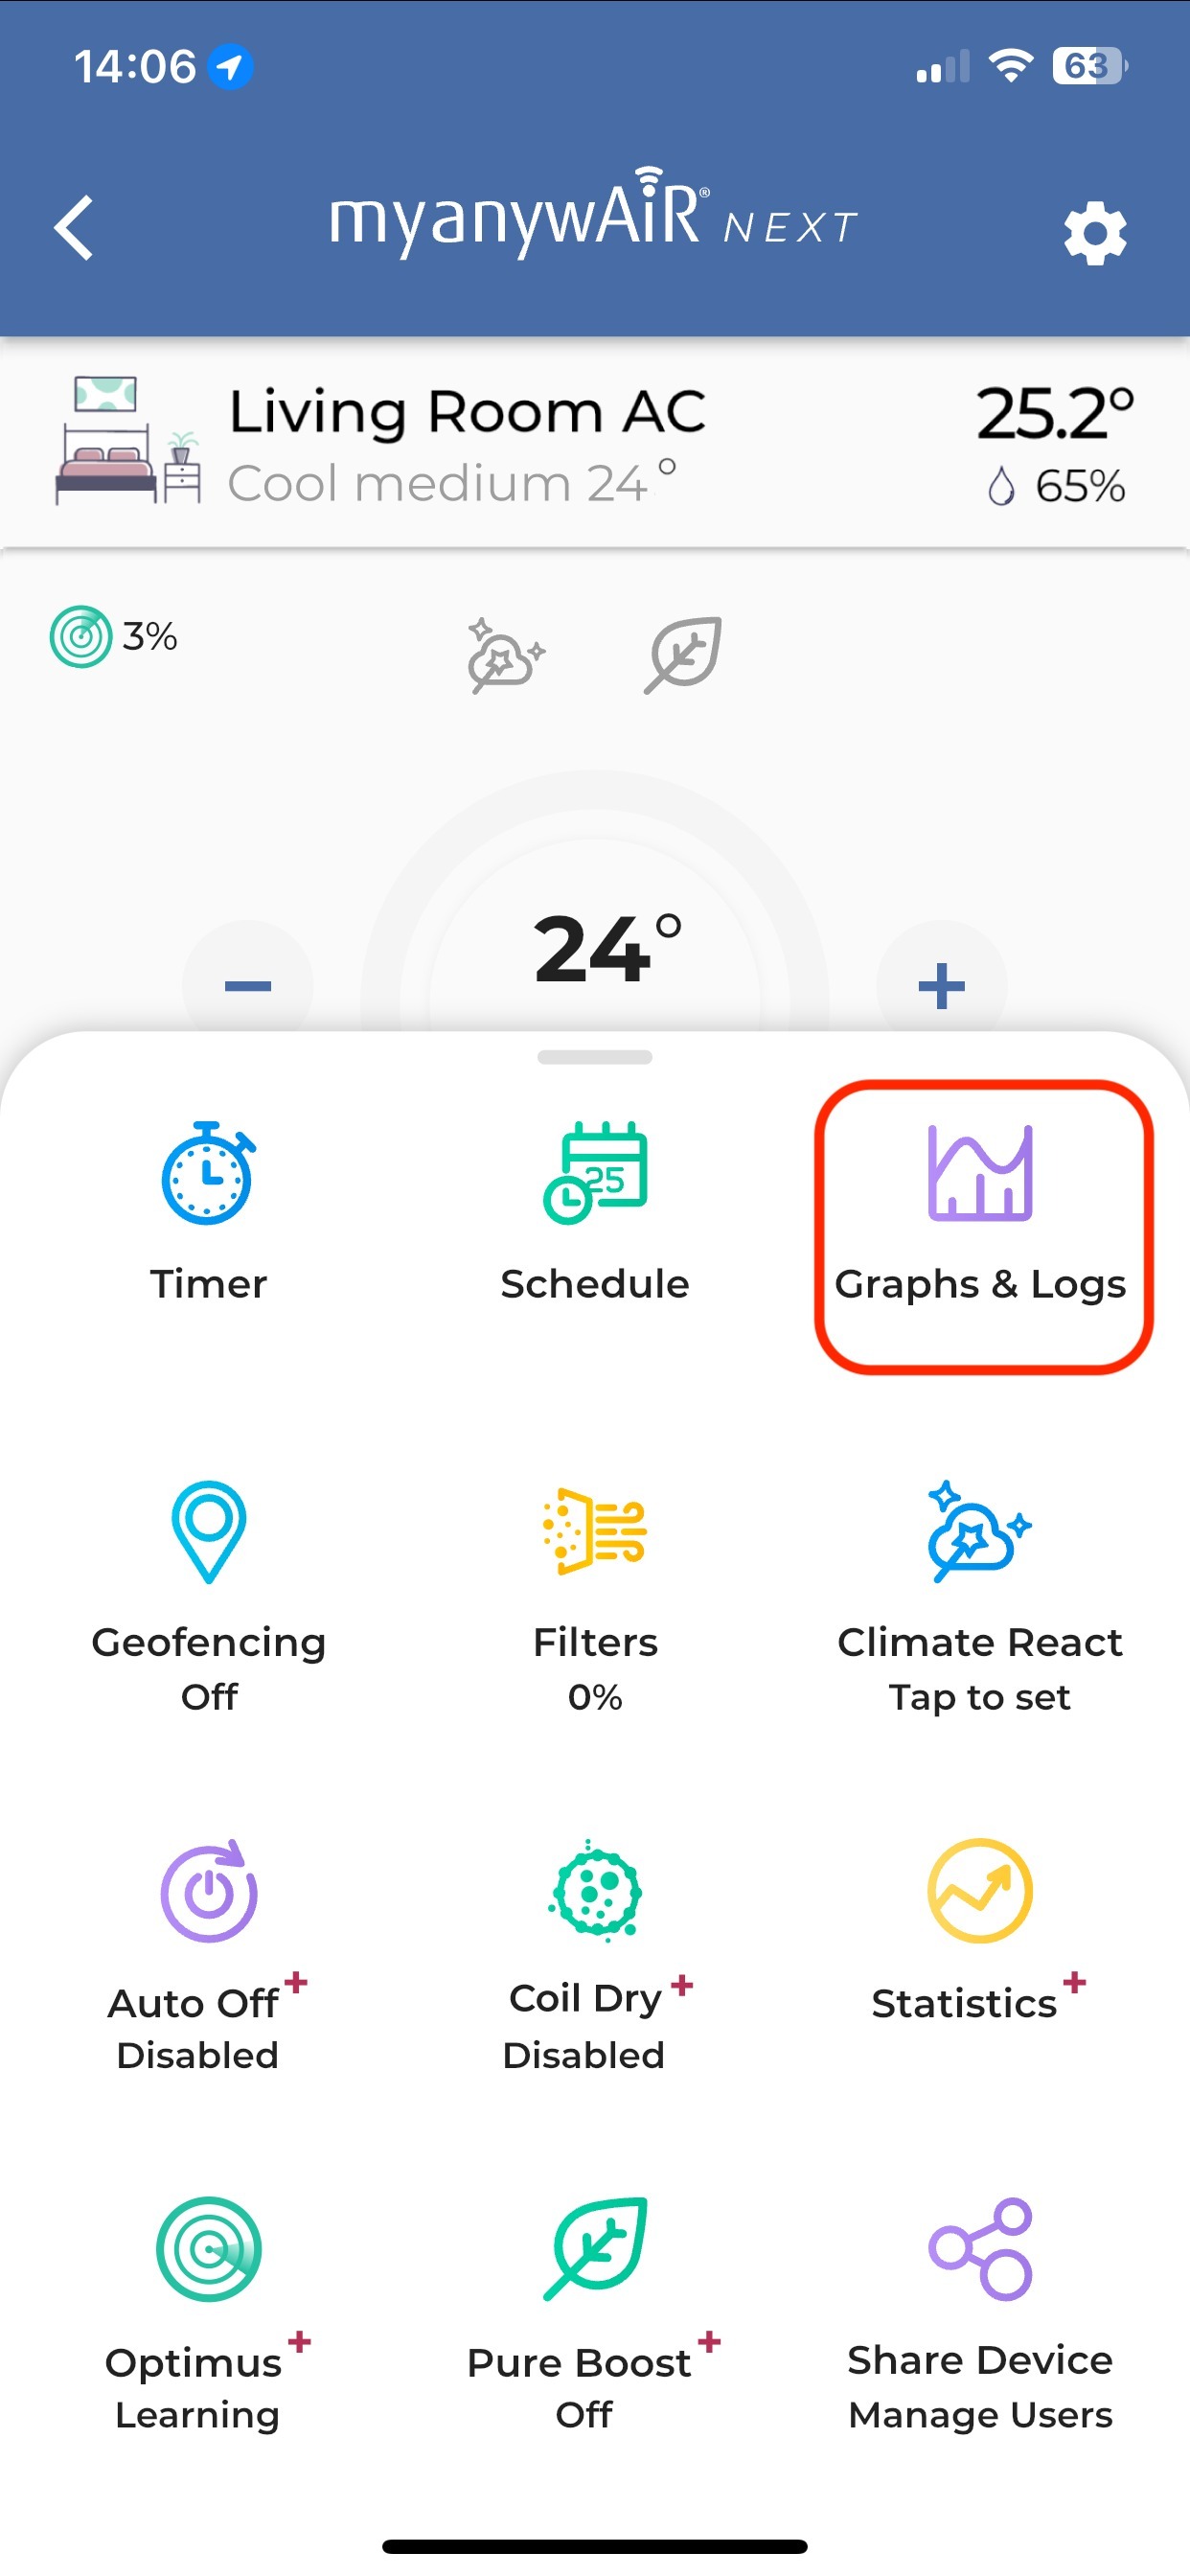 |
| 3 | Select Graphs & Logs. |
| 4 | Choose the required viewing period, such as Hour or Day. Week and Month views may be shown where available.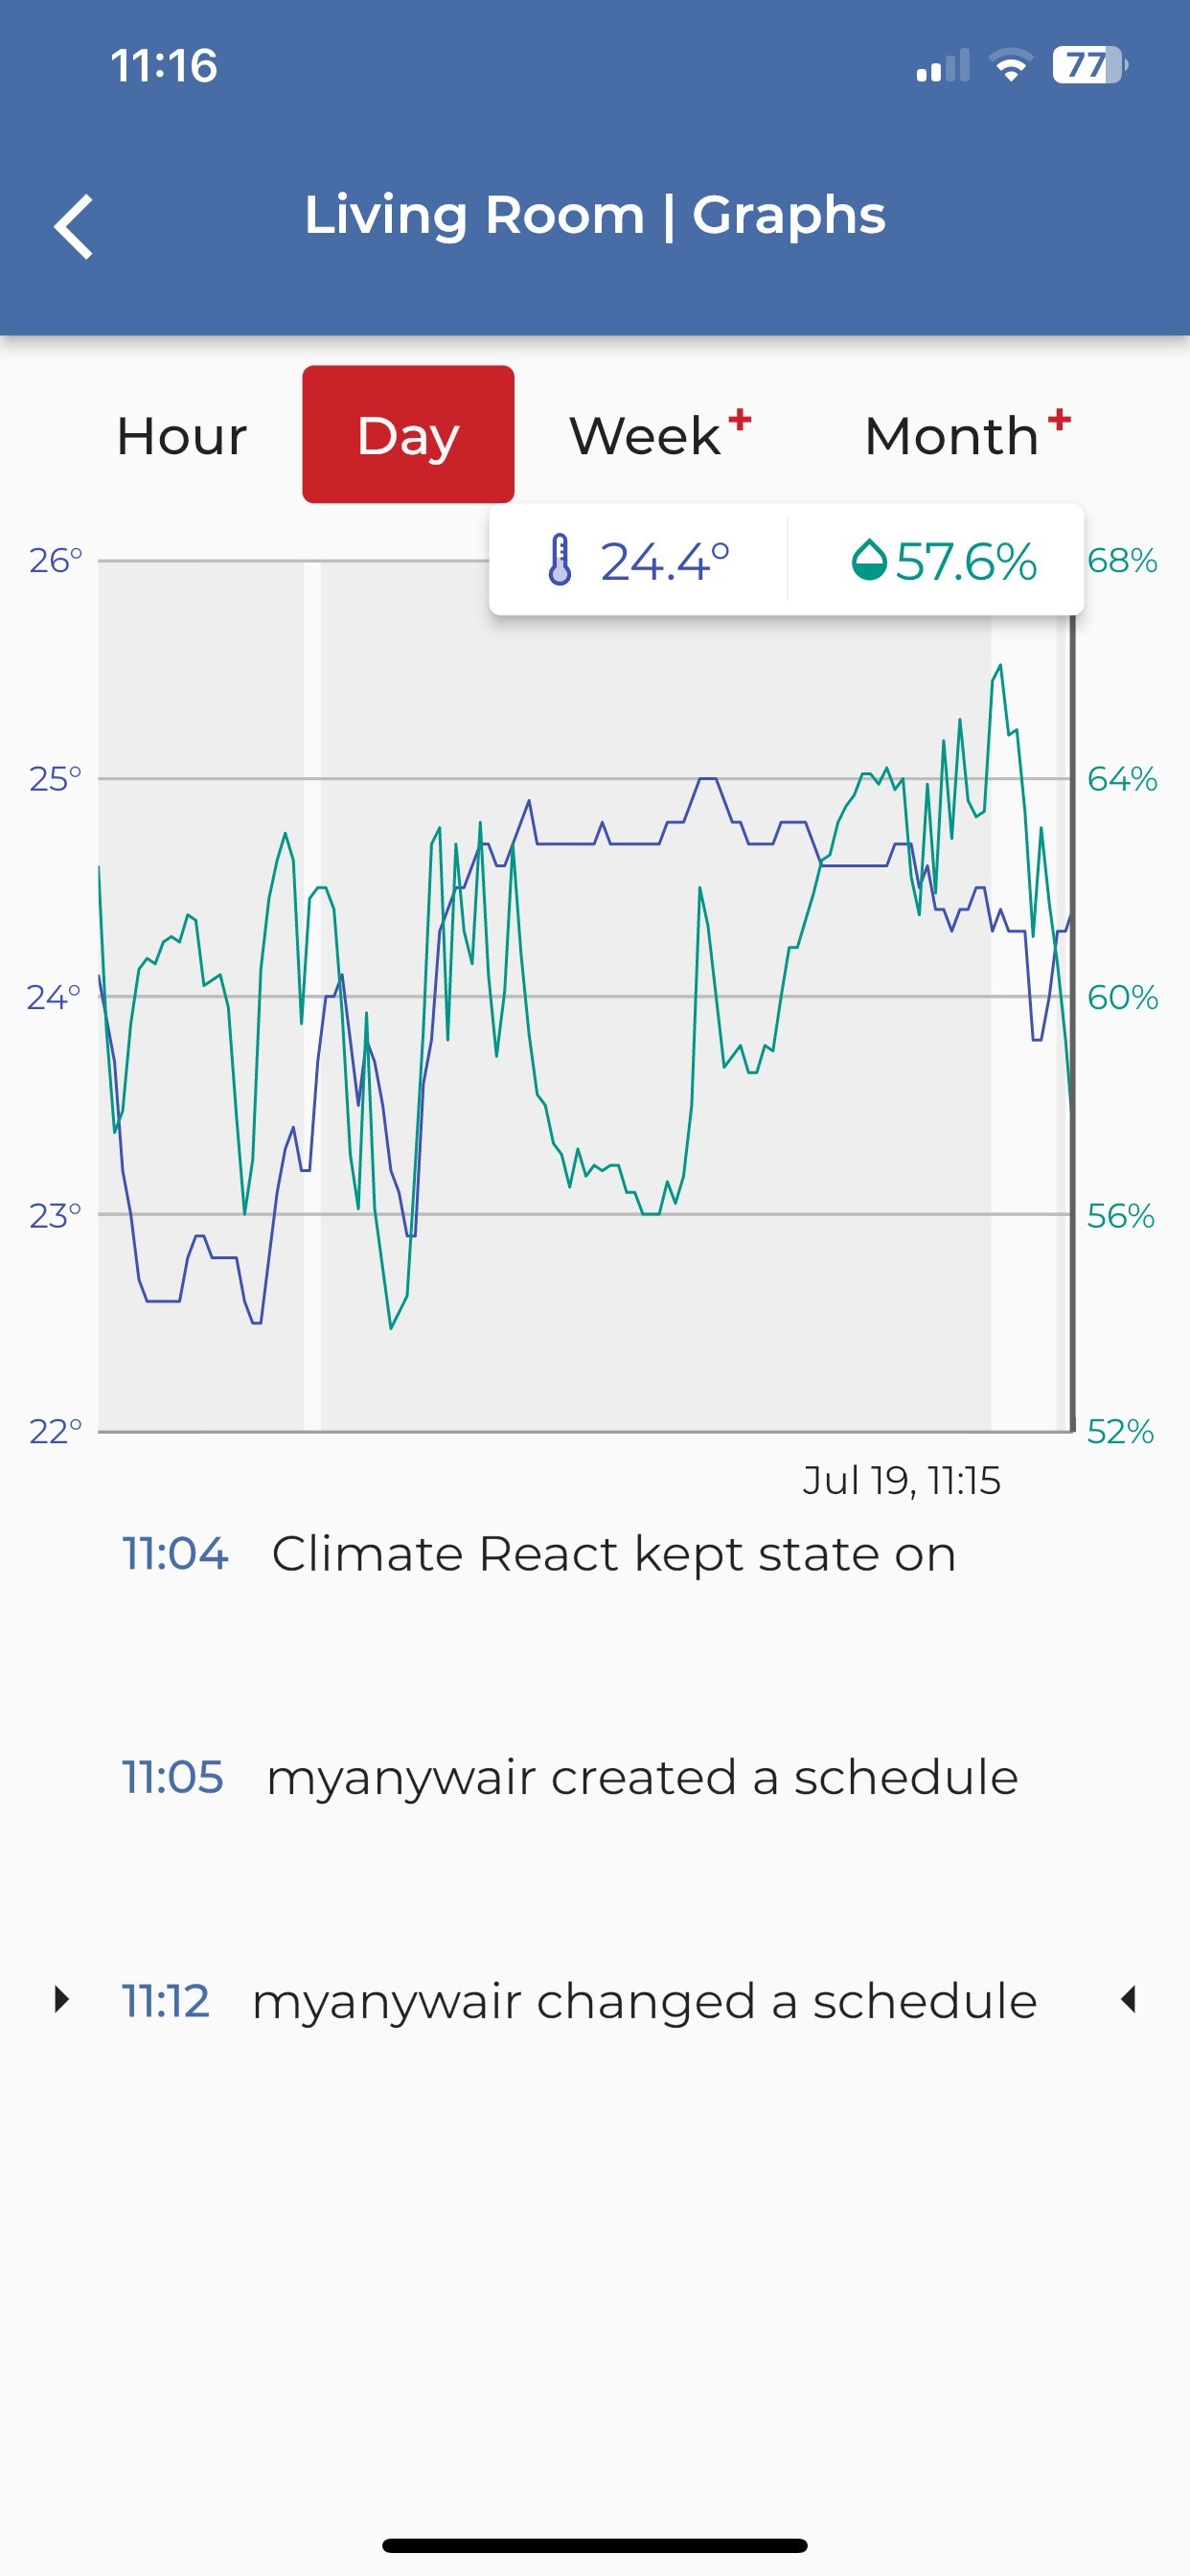 |
View graph information
Depending on the installed sensors and available features, the graph screen may display:
- Temperature and humidity
- TVOC air-quality readings
- CO2 readings
- Outside pollution information
| Action | Result |
|---|---|
| Select a graph icon | Changes the information displayed on the graph. |
| Swipe left or right on the graph | Moves through the available timeline. |
| Press or drag across the graph | Displays the recorded value and time for a specific point, where supported. |
| Select Hour, Day, Week or Month | Changes the reporting period. Options marked with a plus symbol may require an additional feature or subscription. |
Review the event log
The event log appears below the graph and records activities against the selected device. Entries may include:
- Climate React actions
- Schedules being created or changed
- Air-conditioner state or setting changes
- Actions made by a named user
Important: Graphs and logs are historical records and may not update instantly. Allow time for the controller to synchronise with the app, particularly after a temporary internet or Wi-Fi interruption.
If data is missing or not updating
| 1 | Confirm the myanywAiR NEXT controller is online and showing current room information on the main device screen. |
| 2 | Refresh or reopen the device screen and allow time for the latest data to synchronise. |
| 3 | Confirm that the relevant sensor or feature is installed and available for the selected device. |
| 4 | Check whether the required Week or Month view is an additional feature marked with a plus symbol. |
| 5 | Ensure the app is updated to the latest available version, then sign out and back in if the issue continues. |
Menu names, graph icons, available data and reporting periods may vary depending on the app version, controller hardware, connected sensors and subscription level.